4MOST Explains
Discover 4MOST’s hardware, operations, and science in articles designed for a broad audience. We remove the jargon from explanations of 4MOST and its science, making what we do accessible to wider audiences (including the many members of 4MOST who struggle to remember the exhaustive list of acronyms).
Articles:
- What is 4MOST?
- Operations and Data Flow
- What is a Spectrum?
- Glossary: acronyms and technical terms explained
What is 4MOST?
Authors: Matt Quilt & Harry Addison
The Four-metre Multi-Object Spectroscopic Telescope (4MOST) is a revolutionary astronomical instrument. To understand what it does, let’s break down the name:
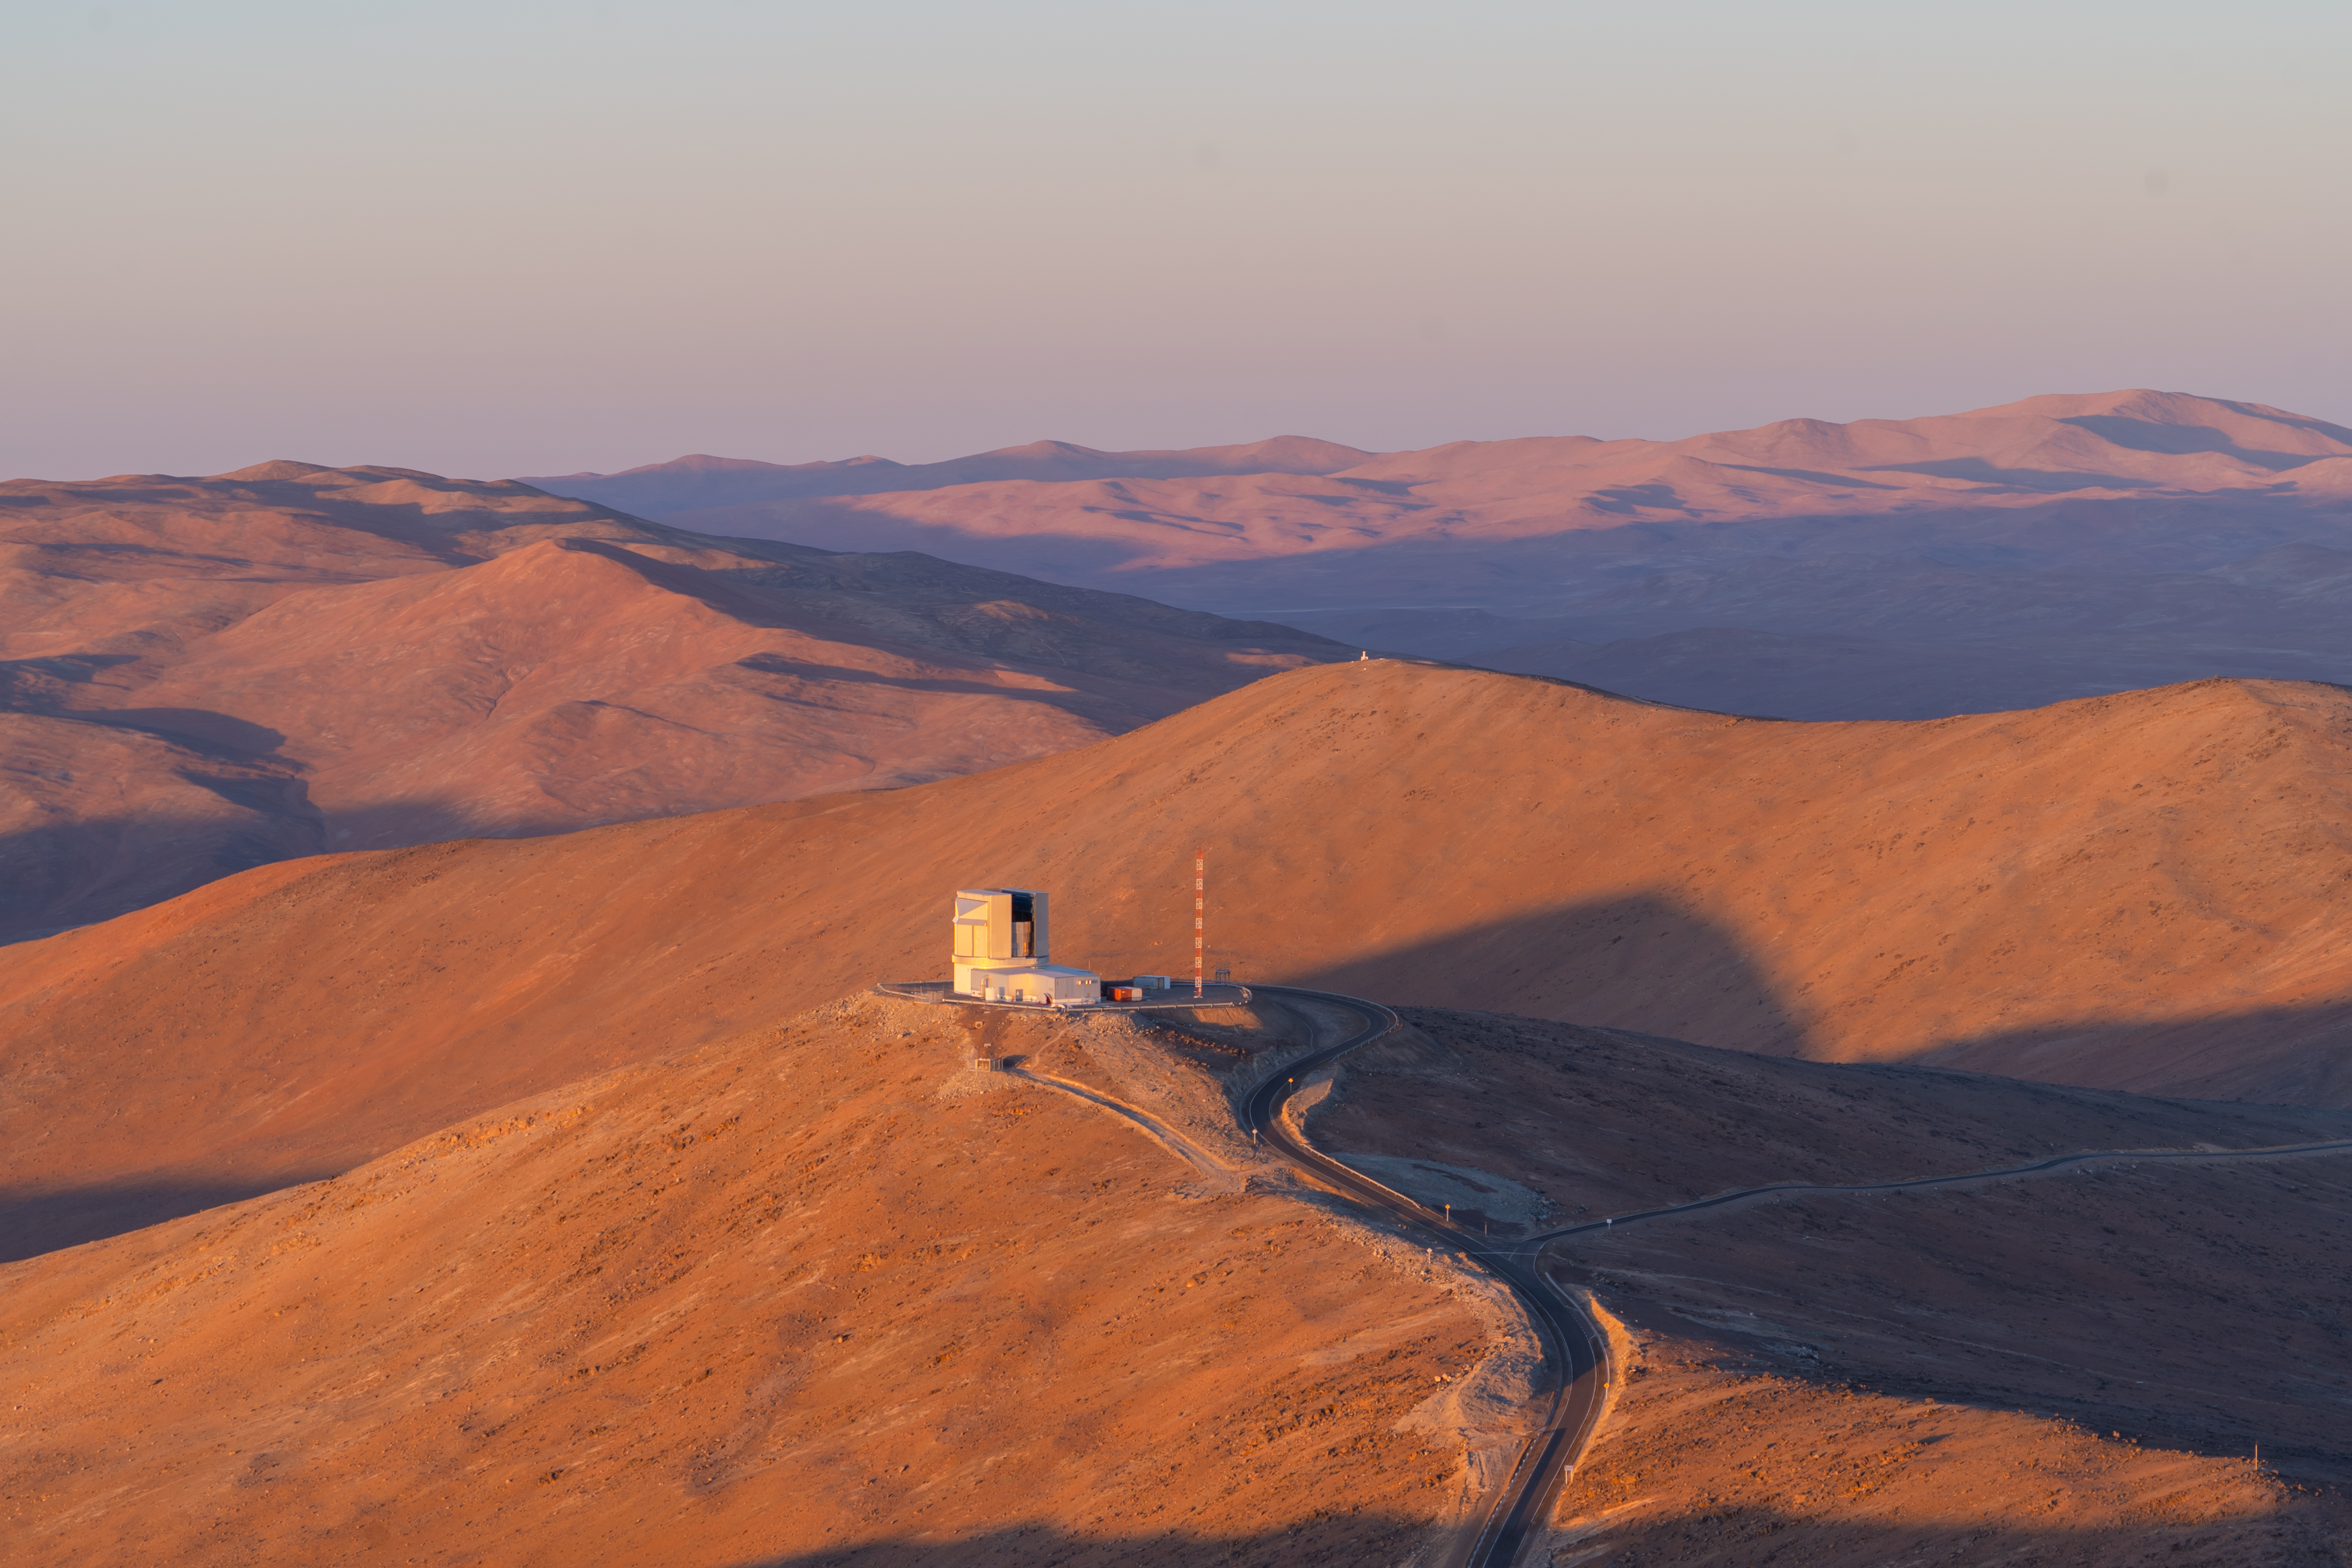
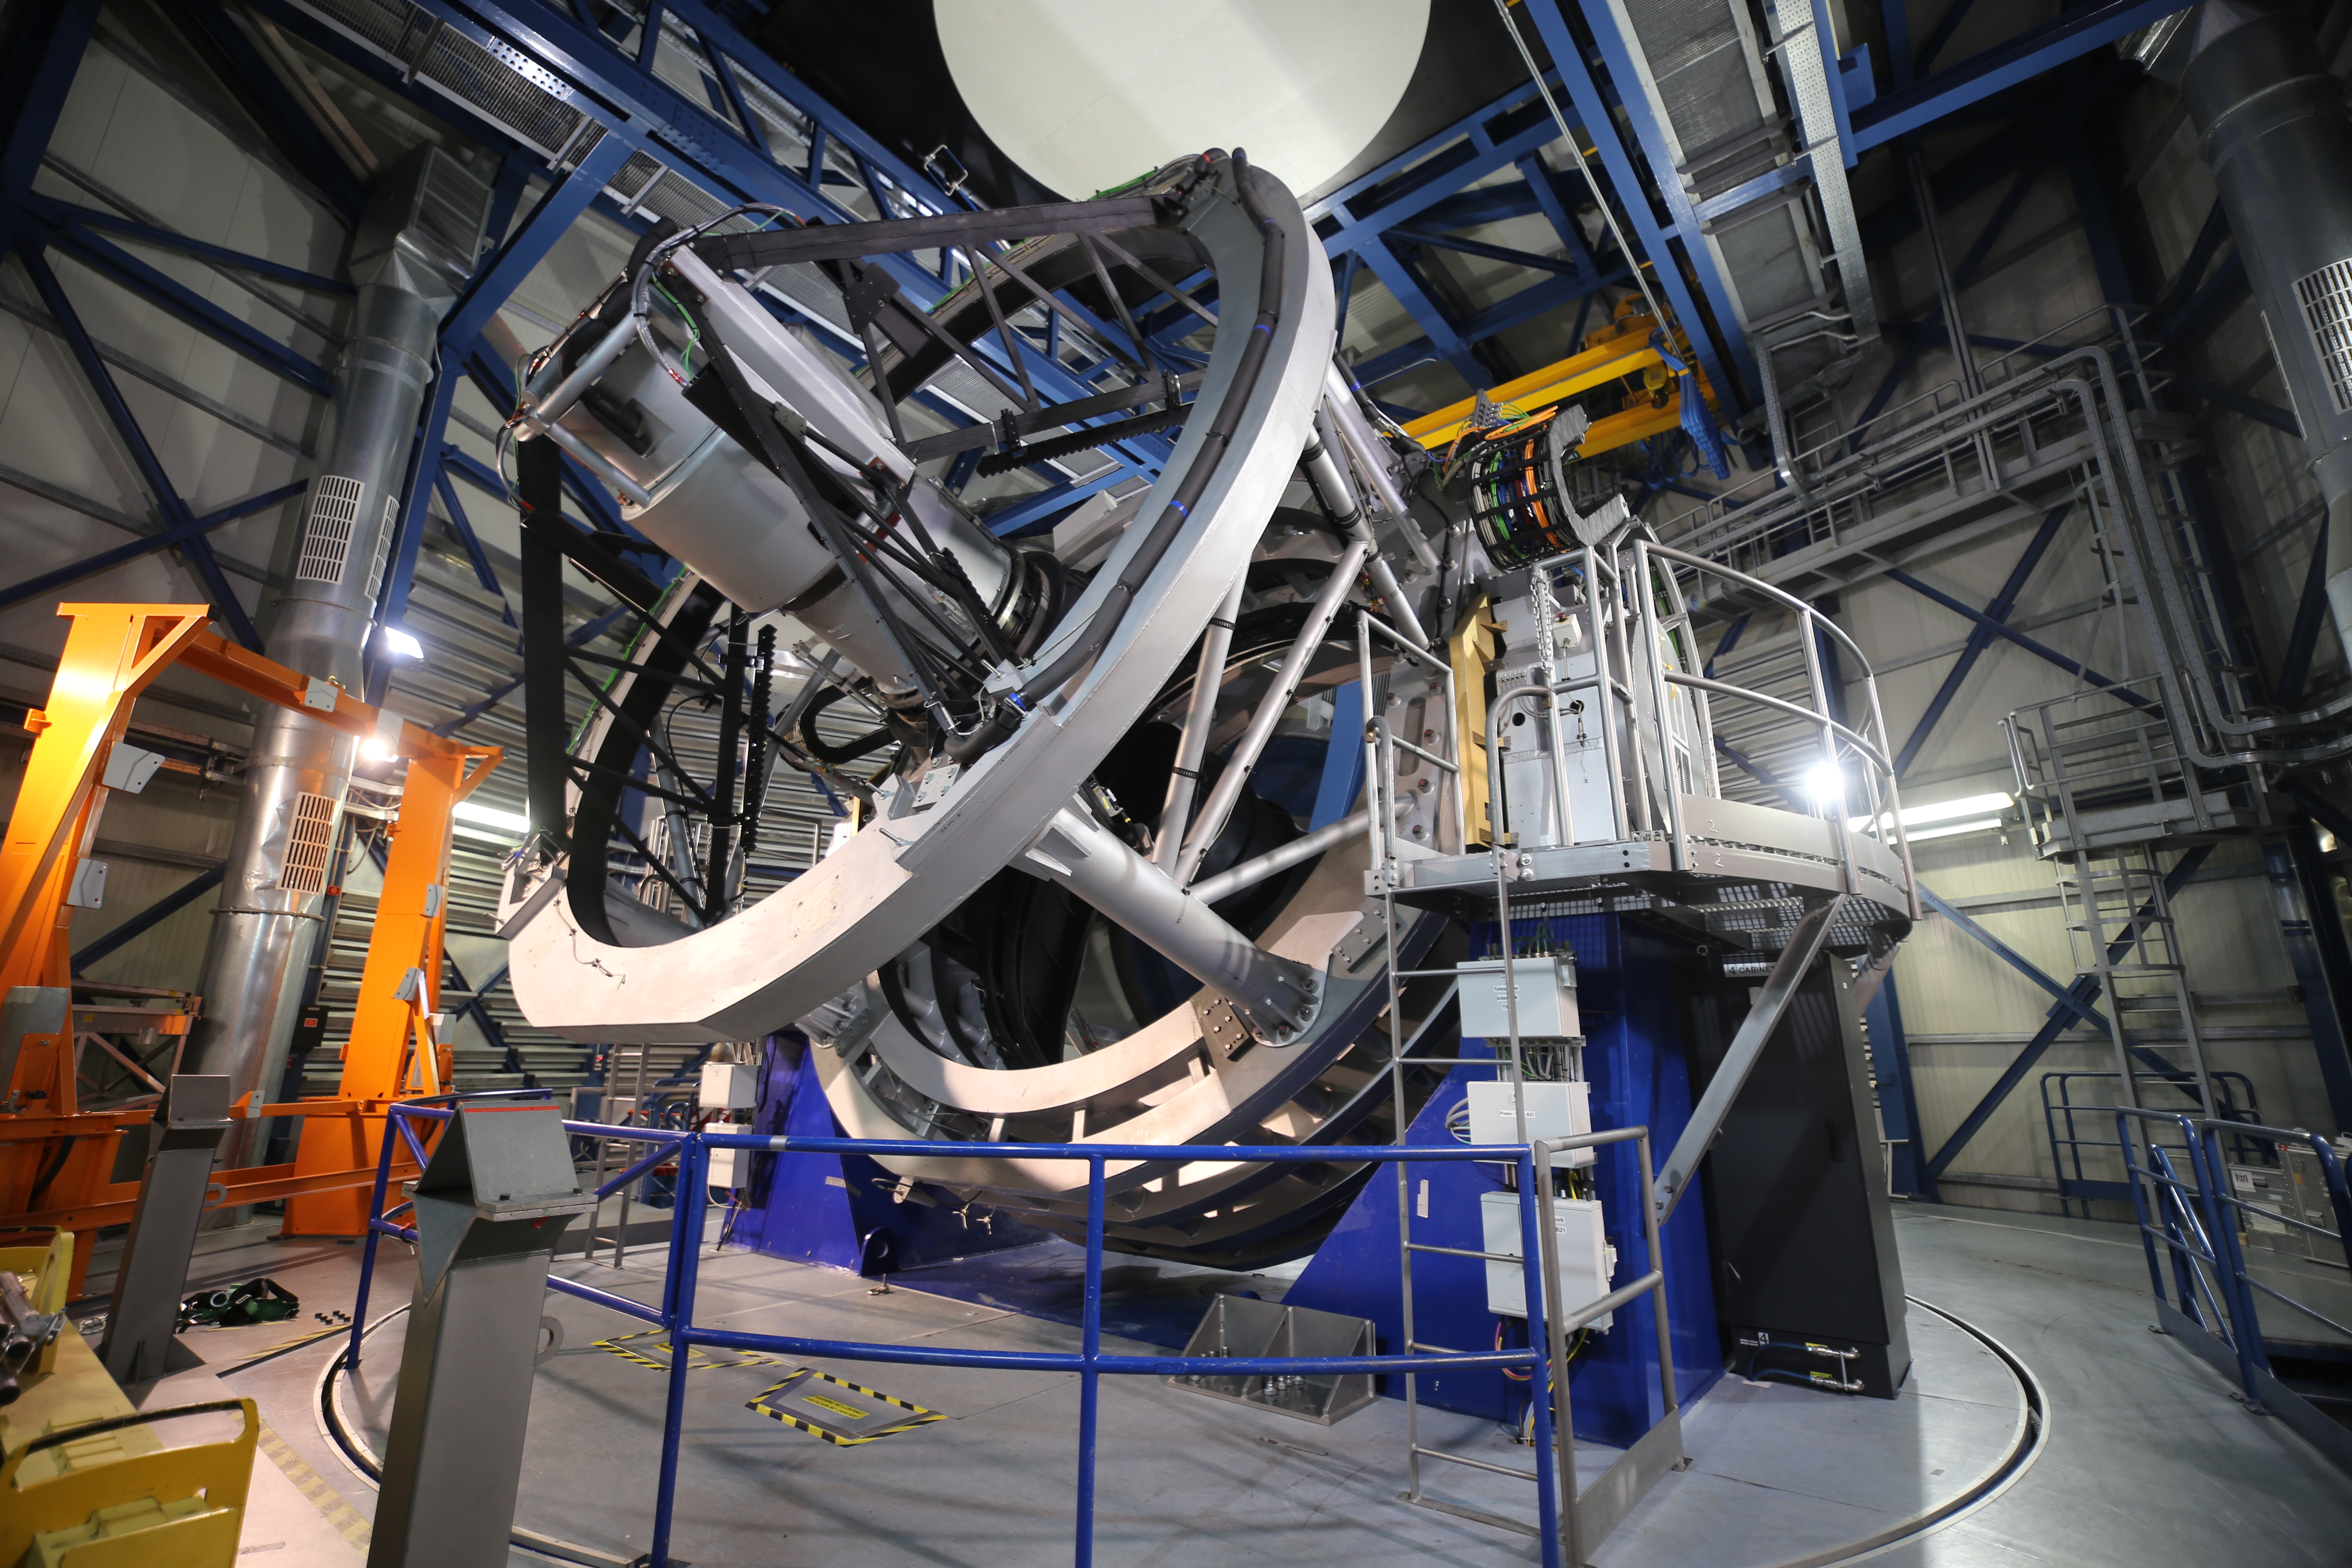
- Four-metre: the instrument is mounted on the European Southern Observatory’s four metre wide VISTA - the Visible and Infrared Survey Telescope for Astronomy. This is huge: for reference, the Hubble Space Telescope is 2.4m wide and 4MOST will be able to observe a patch of sky the area of the 20 full Moons.
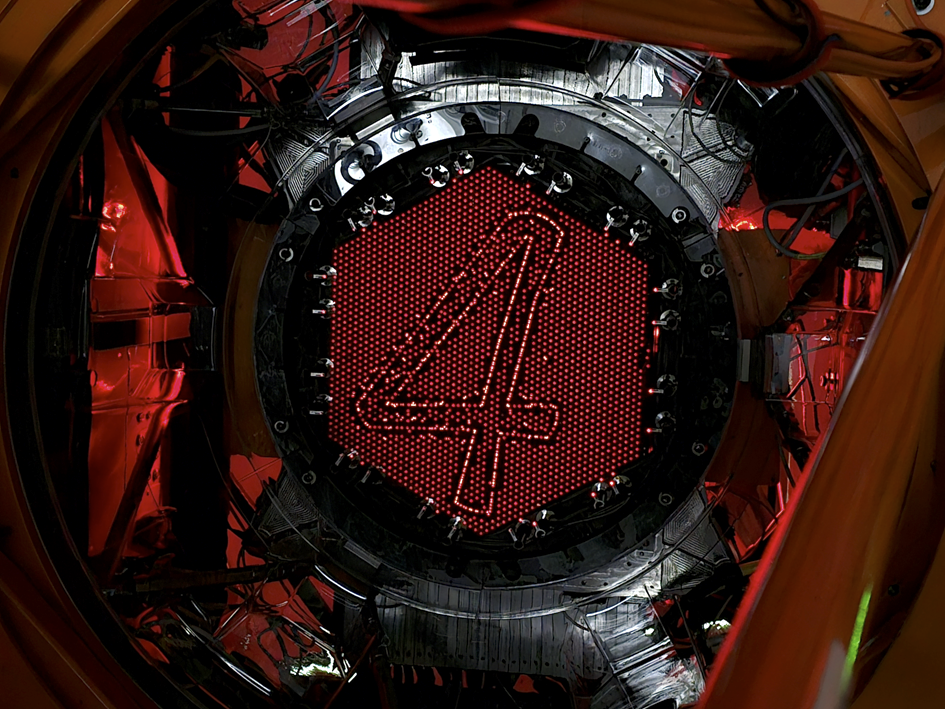
- Multi-Object: one of the main things that makes 4MOST special is its ability to target multiple objects at the same time - 2436! This is made possible by the telescope’s many optical fibres (think of them as wires made of glass); at the same time every fibre is perfectly positioned to point at a specific object in the telescope’s field of view.
- Spectroscopic Telescope: the light that enters each fibre is passed along to ‘spectrographs’. Rather than just produce a picture of the object like ordinary telescopes might do, these spectrographs mean that the telescope splits the incoming light into its underlying colours - creating a rainbow! The brightness of each part of the rainbow can tell you about the source that produced it. For a full breakdown of the spectra these produce, see our guide to ‘What is a Spectrum?’.
Combining these features allows 4MOST to collect detailed information on a vast amount of astronomical objects at the same time, for a variety of science goals. For example, 4MOST will analyse the motion and chemical composition of stars throughout our galaxy to understand the structure and history of the Milky Way: ‘galactic archaeology’. It can also be used to explore the evolution of other galaxies, as well as probing the supermassive black holes and supernova events the galaxies host.
The unique thing about 4MOST is that by having different fibres pointing at different parts of the sky, these different science questions can be investigated at the same time. There are 10 consortium surveys and 15 community surveys with their own science goals, all collaborating on the same telescope! For futher information of these surveys explore our Science pages. As well as collaborations within 4MOST, there are also collaborations with other telescopes that have their own specialties in wavelength range and sky coverage, building a more complete picture than either telescope could individually. Astronomy is a field based on working together!
If you’d like to find out more about 4MOST and the science we do, the rest of the 4MOST Explains pages are here to help. We’ve written them to be as accessible as possible, with no advanced science qualifications required. Like all sciences, astronomy can often seem overcomplicated due to the excessive use of acronyms and jargon - for this reason we have curated a glossary of all the terms you’ll need.
Operations and Data Flow
Authors: Matt Quilt & Harry Addison
With the whole southern sky to explore, it’s natural to wonder how we decide what tiny patch to focus 4MOST on at any given time. The flowchart below shows the full process for how we decide what to observe and how that data makes its way to scientists and the public - as you can see, it’s a large collaboration!
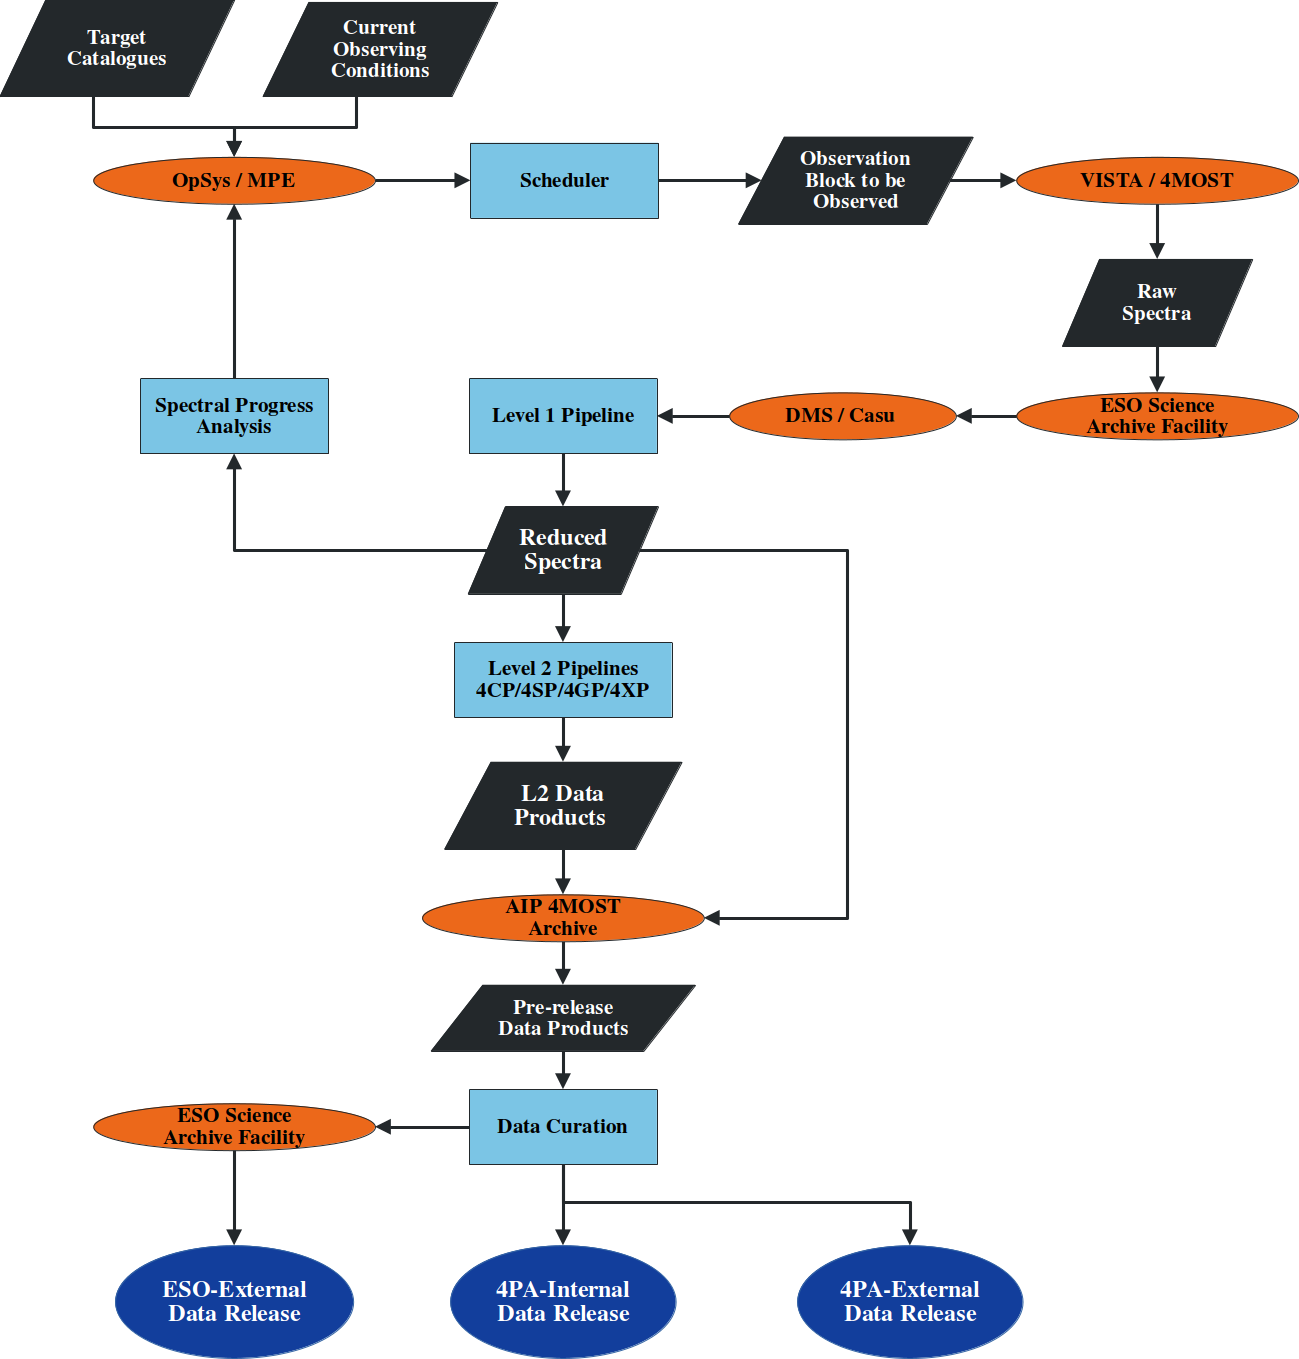
The first stage is the strategy level: we start with a huge catalogue filled with millions of previously observed objects in the sky collected by other telescope surveys in the past and present: the target catalogue. This data is fed through the Operations System (OpSys) hosted at the Max Planck Institute for Extragalactic Physics (MPE) in Munich. OpSys uses the properties of the telescope as well as long term goals/synergy with other telescopes to decide what would be the optimum targets to look at, which fibres to assign to which targets, for how long and, importantly, how to optimise for the current weather conditions. These instructions are written as Observing Blocks (OBs), which contain everything the telescope needs to know to run automatically.
A scheduler program then designs the plan for which OBs will be run for the night. From here they are fed to the telescope one by one and the scheduler can provide back up targets when weather conditions are unexpectedly bad (e.g. thick cloud, strong wind making it difficult to point the telescope in certain directions).
Now, the telescope acts out the instructions stored in the OB and we collect our data! This raw data is sent to the European Southern Observatory (ESO) Science Archive Facility for storage and initial quality control to make sure the telescope is running as it should.
From here, if the data looks healthy, it is passed forward to the Data Management System (DMS) at the Cambridge Astronomical Survey Unit (CASU). The raw data is processed to create complete, calibrated spectra ready for science use: level one of the processing pipeline. Metrics such as the confidence of the estimated redshift and the ratio of the genuine signal to random noise are calculated to determine if more observation time is needed for that object. This is fed back to the strategy program, creating a feedback loop which means targets are in the queue to be observed until the data is of good quality. This reduces the amount of poor quality data and also ensures observing time is spent efficiently, not ‘over-observing’.
Once a quality spectrum has been compiled from enough raw data, it passes to level two of data processing. There are four separate pipelines that can be run on the data, depending on the source:
- 4CP: the classifier pipeline, this uses a machine learning technique called a neural network to estimate what type of object the spectra came from: e.g. star, galaxy, quasar
- 4SP: the selection function pipeline, this calculates how many targets are observed for a given brightness, which helps to build the selection function - criteria for what objects 4MOST is able to observe. By understanding the selection function (e.g. we miss most galaxies below a certain brightness), we understand the biases in our survey which allows us to correct for them in analysis and compare with other surveys
- 4GP: the galactic pipeline, used on stars to extract information about them such as their temperature, chemical composition, surface gravity and relative velocity to Earth
- 4XP: the extragalactic pipeline, used for galaxies to measure things like emission line strengths, redshift, total brightness of the stars, etc.
Further quality control is run by looking for relationships in the extracted data products: for example, we would be worried if more northern objects were observed to be further away- this would be a ‘spurious correlation’ (i.e. an apparent relationship that is not real) that implies something is wrong with the way we are observing or processing the data.
Next, the data is passed on to the 4MOST archive at AIP (Leibniz Institute for Astrophysics Potsdam) to await release and undergo data curation. Any spectra that were flagged in the pipeline can be visually inspected before release and any problems can be used to further refine the pipeline.
Data is shared internally to 4MOST scientists every three months and will also be shared externally at less frequent intervals (roughly annually). Additionally, ESO will compile their own data release every fifteen months on the ESO Science Archive Facility. Check back here to find out how you can download the data for yourself once it’s ready!
What is a Spectrum?
Authors: Matt Quilt & Harry Addison
Spectrum Basics
The light we receive from a source can tell us a lot about what produced it. Brighter, more blue light intuitively tells us that an object is hotter, but there is far more information carried than this. You may have seen before that different chemical elements glow with specific colours when you heat them up: sodium street lamps glow orange, copper can turn flames green and strontium is used for red fireworks. Each type of atom (e.g. hydrogen, carbon, oxygen) has its own set of allowed energy levels that electrons can sit at, like a ladder with the rungs at different levels for different elements.
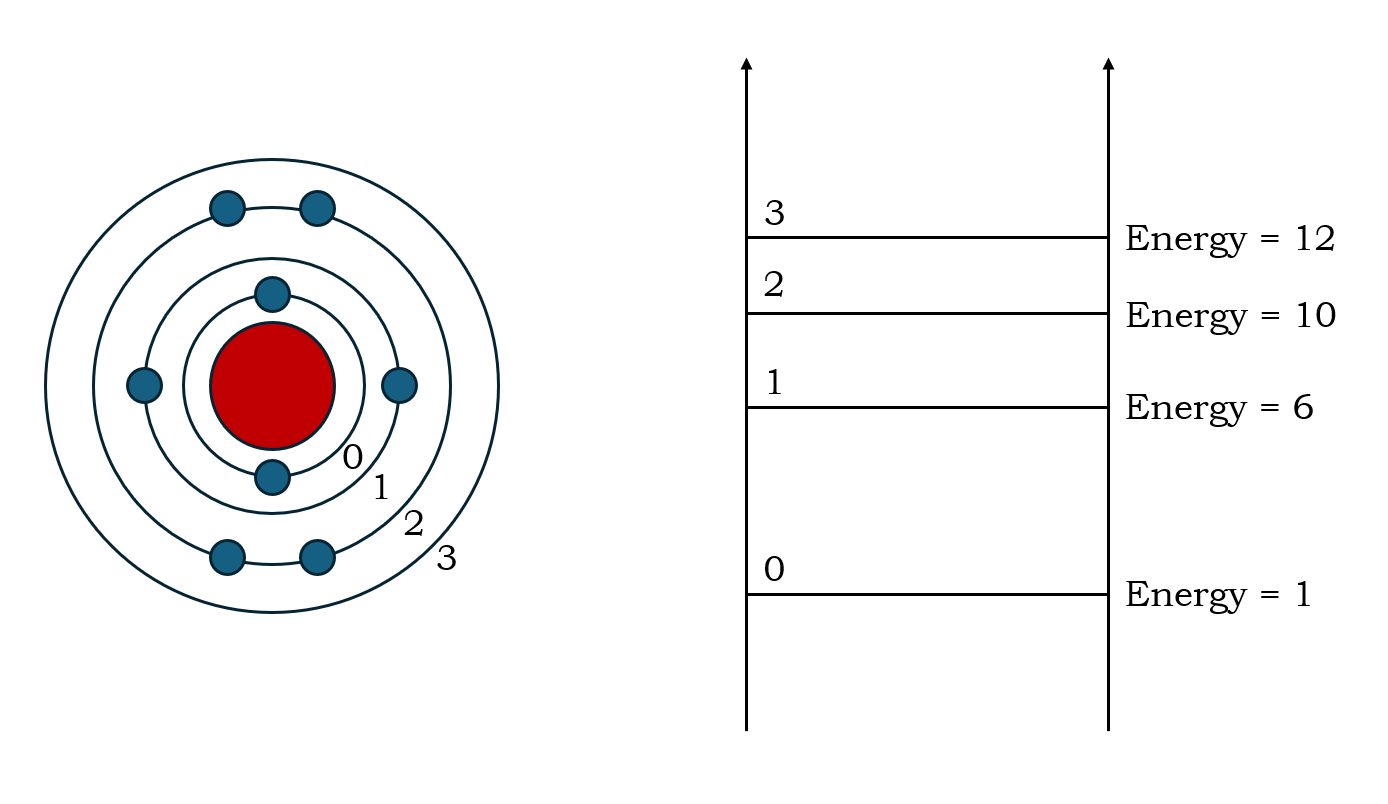
When the atoms are given some energy, maybe heated up by powerful photons from a star, the electrons can grab enough energy to jump up to higher allowed energy states. For example, an electron in our example atom could be sitting with energy 1 and grab a photon with energy 5 to jump up to the state with energy 6. This removes a photon with energy 5 from the star’s light. After some time, the electron can get rid of this excess energy and return to 1 from 6, releasing a photon with energy 5. Therefore, when the light from the star interacts with our example atoms, we would expect to see photons with energy 5 either taken out or added if the rate of release does not perfectly balance the rate of absorption.
When 4MOST splits up the light from a source into its different energies (or wavelengths- remember each wavelength matches a specific energy), we call this a spectrum and can check to see what is happening at an energy of ‘5’. If we see photons have been taken out (an absorption line) or added in (an emission line), that’s strong evidence that there is our example atom in our source! An absorption line tells us that we have cool atoms which are mostly absorbing and an emission line tells us there are hot atoms mostly emitting. By imagining our example atom as neon, you can also understand how neon lights work- electricity is used to heat the neon gas so that it emits more than it absorbs, releasing photons with a fixed energy and therefore fixed wavelength and therefore fixed colour!
We know what wavelengths to expect for each element by running experiments on Earth, so we can check our spectra (plural of spectrum) and see what matches we can make. This allows us to figure out which elements are present in what we’re pointing the telescope at and get an idea of the temperature.
Extra Information in Spectra: Distance from Redshift and Velocity from Line Broadening
We have seen how spectra can be used as a ‘recipe’ for objects in space, allowing astronomers to infer what they are made from. However, the fact that the ‘ingredients’ are moving in an expanding Universe while interacting with light adds even more information.
The expansion of the Universe means that light gets stretched out as it travels to us; wavelengths get longer and therefore more red, hence the idea of ‘redshift’. Given that we know what the wavelength of certain spectral lines should be, we can use how much they’ve been shifted to figure out how long the light has been travelling through expanding space. We know that the speed of light is constant in a vacuum, so we can therefore work out the distance to the source too!
To understand line broadening, consider a group of ambulances, all driving in a circle. You may have noticed that when a siren (like that on an ambulance) moves towards you, the sound gets higher pitched and then becomes lower pitched as it moves away. This is an example of the Doppler effect: the sound wave gets bunched together when the source is moving towards you and gets stretched out when moving away. The same thing can happen to light when the source is moving- this creates another form of redshift when it moves away and ‘blueshift’ when it moves towards us.
Now picture some hot gas orbiting a black hole: the gas is our circle of ambulances and the emission line at 5 energy units is our siren with a fixed wavelength. As the gas goes round the circle, it will sometimes be coming towards us, sometimes moving away and sometimes neither. This causes the light to be redshifted, blueshifted or neither. Now our light at 5 becomes smeared out across, e.g. 4-6: the line is broadened. The faster the gas orbits, the more (red/blue)shifting occurs, broadening the line more and more. This means that astronomers can use the width of the line to calculate how fast the gas is orbiting. We can even use this to estimate how far away from the black hole the gas is orbiting- you may know that the planets on the edge of our solar system take much longer than 365 days to orbit the Sun; they orbit with much slower velocities according to Kepler’s Laws.
Therefore, imagine we checked a new spectrum measured by 4MOST and identified our example emission line, which we expect to be at 5, now centred at 10 but largely smeared out across 8-12. Just from this, we can learn that our example gas is present, it has been redshifted by a factor of 2 (which corresponds to about 17 billion light years away!) and is moving fast, potentially orbiting close to a black hole!
Of course there are many more effects to consider in spectroscopy (the study of spectra), such as having more than two energy levels, the reddening from dust and what causes non-symmetrical broadening. We also need to consider that these energy levels are quantum effects: they are multiple solutions from solving the Schrödinger equation for a given type of atom. If you are interested in spectroscopy, go and investigate these for yourself!
Example of What Science 4MOST Will Do With Spectra: Type Ia Supernovae
One type of spectrum 4MOST will be looking for is that of a ‘Type Ia’ (one-a) supernova. Their spectra are characterised by broad emission features, the lack of hydrogen lines, and distinctive silicon absorption features. The lack of hydrogen in the spectrum tells us that the supernova was produced from a star that had burned through all of its hydrogen fuel via nuclear fusion. The absorption features seen in tpye Ia supernova spectra, such as the distinctive silicon absorption features, in form us of the elements that were produced in the star via nuclear fusion as well as those created during the explosion of the star.
Additionally, we know that the explosions that produce type Ia supernova spectrum always happen with the same brightness, so we can measure how bright it appears to us to figure out the distance. To understand this, imagine knowing how bright a candle is and then moving it away some distance. By how much fainter the candle looks, you can figure out the distance (the brightness gets divided by the distance squared). We can also measure the redshift using the spectrum of the galaxy where the supernova took place; the galaxy spectrum will have more lines (including lots of bright hydrogen lines from still-active stars) and less line broadening, allowing for accurate redshift measurement. Together, this gives us a way to convert between redshift and distance.
This method allowed us to discover that further away galaxies have a higher redshift: they are moving away from us faster. This implies the Universe is expanding! To understand this, imagine being inside a cake full of raisins as it is baked. If the cake doubles in size over 30 minutes, a raisin 1cm away will now be 2cm away while a raisin 5 cm away will now be 10cm away. The first raisin travelled 1cm in 30 minutes while the second travelled 5cm in 30 minutes: within an expanding object, further away points move away from you faster according to the speed at which the object expands. Therefore, measuring the conversion between distance and redshift using supernovae tells us about how fast the Universe is expanding: light will be redshifted more across the same distance if space is expanding faster.
With 4MOST, we expect to observe 18,000 new Type Ia supernovae (massively increasing our current sample of around 3000) and measure over 100,000 host galaxy redshifts, working together with other telescopes like the Vera C. Rubin Observatory to provide accurate redshifts for supernovae they discover. This vast collaboration will revolutionise transient astronomy and allow us to measure the expansion of the Universe with far greater accuracy.
Glossary: acronyms and technical terms explained
- 4MOST - Four-meter Multi-Object Spectroscopic Telescope; a large facility for collecting and splitting up the light from many objects at once.
- AGN - active galactic nucleus; the centres of most galaxies have supermassive black holes and when these swallow up material, that material gets incredibly hot and luminous such that we see its emission.
- CASU - Cambridge Astronomical Survey Unit; this team helps with extracting science from the raw telescope data.
- Cosmology - the study of the evolution of our Universe, often focusing on measuring the rate of its expansion and understanding its origins.
- ESO - European Southern Observatory; this vast international collaboration owns the telescope 4MOST uses and publicly shares the data it collects.
- Fibre - a fibre-optic tube that can collect light from a specific point on the sky and pass it to the spectrographs – 4MOST has nearly 2500 of these.
- OB - observing block; a little packet of instructions that tell the telescope everything it needs to know so that it can run automatically (e.g. where to look, for how long, with what fibre).
- Photometry - measuring and analysing the amount of photons captured through filters that only let photons in a specific range of wavelengths pass through; this is quicker than the spectroscopy 4MOST does but doesn’t give as much detail.
- Photon - a packet of light; light can be considered a stream of photons.
- Quasar - particularly bright AGN; from ‘quasi-stellar’ as they outshine their host galaxy so much that they appear as point sources like stars.
- Redshift - the amount by which the wavelengths of light from a source have been stretched by the expansion of the Universe; we can translate this into a distance using cosmology.
- Spectrum - a breakdown of how many photons we observe at different wavelengths; the presence of strong peaks/troughs at specific wavelengths can tell us which elements are present.
- Spectroscopy - the science of collecting spectra (by breaking up the light into components at different wavelengths) and analysing them to find out properties of the source like chemical composition, density, temperature, etc.
- Supernova - SN (plural supernovae/SNe), the explosive deaths of stars; these come in different types depending on the emission lines in the spectrum: type I SNe have no hydrogen lines while type II SNe do.
- VISTA - Visible and Infrared Survey Telescope for Astronomy; the telescope on which 4MOST is installed.
- Wavelength - light is made of waves: the structure of these waves repeats in space and the distance it takes for the wave to repeat is the wavelength. The wavelength tells us the energy of the photon - short wavelength light has more energy and is more blue than longer, less energetic, redder wavelengths.